Introduction
The workshop's assigned-person comparison gives page B a larger signup rate. Could random allocation alone produce different-looking groups, even if page assignment did not change anyone's outcome? A small hand exchange makes that question concrete before you generate a distribution of real randomized differences.
This independent environment already contains the correct person-building and rate-comparison functions taught in the previous lab, plus its own original data. You need those ideas, Python functions, basic NumPy arrays and introductory Matplotlib. No previous VM files or statistical inference knowledge are required. You will locate and edit functions in WebIDE, save them, then run stages in its terminal. Results only displays saved artifacts. You will save 399 exploratory reassignments and their actual chart; you will not calculate a p value or choose a winner here. All records are original synthetic teaching examples. The 65-minute duration is an author estimate including reading and ordinary corrections.
Exchange People Without Changing the Group Sizes
In this step, you will read a working person table, implement a difference statistic and observe how exchanging two group memberships changes it.
Open WebIDE. Use File > Open Folder... to open /home/labex/project/signup-experiment; Explorer lists this unit's files. Choose Terminal > New Terminal and explicitly enter the workspace. This is a new environment, not the previous lab's terminal or filesystem:
cd /home/labex/project/signup-experiment
For saving, use WebIDE’s File > Save menu. Optional shortcuts are Ctrl+S on Windows/Linux and Cmd+S on macOS. For Find, click inside the code editor first; use Ctrl+F or Cmd+F for the same respective platforms, then Esc to return to editing.
The prepared outcomes.py and compare.py already implement the previous unit's contracts. In Explorer, open each and locate build_people and summarize. Then open run.py and locate base_result: it calls those functions before asking for a new sampled analysis. You will preserve their valid behavior and implement the new functions in resample.py.
First produce a normal result with the already learned function:
python3 run.py people
python3 show_results.py people
Read all 12 distinct visitors, including legitimate zeros. This proves the existing person-building path works; it has not performed a reassignment. This unit's Results file list focuses on contrast/sample artifacts, so use the terminal reader for this initial person table.
cat reads a file without changing it. Review the six-person worked example:
cat warmup-visitors.csv
The six cards have binary outcomes [1, 0, 0] in A and [1, 1, 0] in B. Each 1 or 0 belongs to one assigned person; repeated events are not additional observations. A has 1/3 signed up, B has 2/3, and B−A is about +33.33 percentage points.
Imagine exchanging A's second person (outcome 0) with B's first person (outcome 1). A becomes [1, 1, 0], B becomes [0, 1, 0], and the difference becomes about −33.33 points. Three people remain in each group and three positive outcomes remain overall. You changed the allocation, not the person outcomes or total sample size. Predict the sign before running.
Open resample.py in Explorer. It imports NumPy as np and defines two existing functions, difference and sample_null. Both marked regions are incomplete. Defining the second function does not execute it; you can implement and test the first without replacing either signature or the rest of the module.
Take a checkpoint. cp copies the current source to a .bak file, which Python does not treat as a sibling module:
cp resample.py resample.before-contrast.bak
np.mean averages binary outcomes. Multiplying B's mean minus A's mean by 100 gives percentage points; float returns a normal Python number. Find Implement difference. after clicking inside the editor: use Ctrl+F on Windows/Linux or Cmd+F on macOS, then press Esc, and replace only its comment and raise with this four-space-indented function body:
return float(100 * (np.mean(b) - np.mean(a)))
Keep sample_null unchanged for now. Choose File > Save; its saved source, not an unsaved buffer, will be run. The runner's contrast stage supplies the original cards and precisely the exchange described above, calls your function twice and saves both actual results:
python3 run.py contrast
python3 show_results.py contrast
Expect original_pp near +33.33 and swapped_pp near −33.33. Neither predicts what would happen to an individual on another page. They show how a fixed collection of outcomes can produce a different group comparison.
Before implementing sampling, make a new checkpoint of the now-working difference function:
cp resample.py resample.before-sampling.bak
If the command raises an editing error, read the filename and line in the traceback, correct that local line in Explorer, save and rerun contrast. For a wrong directory use pwd, ls and the opening cd; do not reset the VM. If needed, the optional command below restores the original pre-contrast scaffold and removes your difference edit, which you must then reapply. The next step's later backup preserves that completed difference instead:
cp resample.before-contrast.bak resample.py
You may edit resample.py and, later, plot.py, or add regular Python helpers beside them. Preserve source CSVs, settings, dictionary, runner and readers. Opening or reconnecting WebIDE does not reinstall the workspace; setup refuses to overwrite progress.
Generate Real Reassignments
In this step, you will repeatedly reshuffle the complete visitor outcomes into groups of their original sizes and save every resulting difference.
Continue in the same WebIDE terminal panel at /home/labex/project/signup-experiment. The full fixed sample has 12 assigned people, six per group. Its prepared outcome function uses the complete seven-day windows. Read the actual full inputs if you want to locate the boundary and no-event people again:
cat assignments.csv
cat events.csv
Under the no-effect null assumption used for this exercise, page assignment does not change any person's binary outcome. Reassigning those fixed person outcomes between the two groups therefore shows variation expected from allocation alone. This assumption relies on the randomized-experiment design represented by these synthetic records. Shuffling an arbitrary observational website log would not create a randomized experiment.
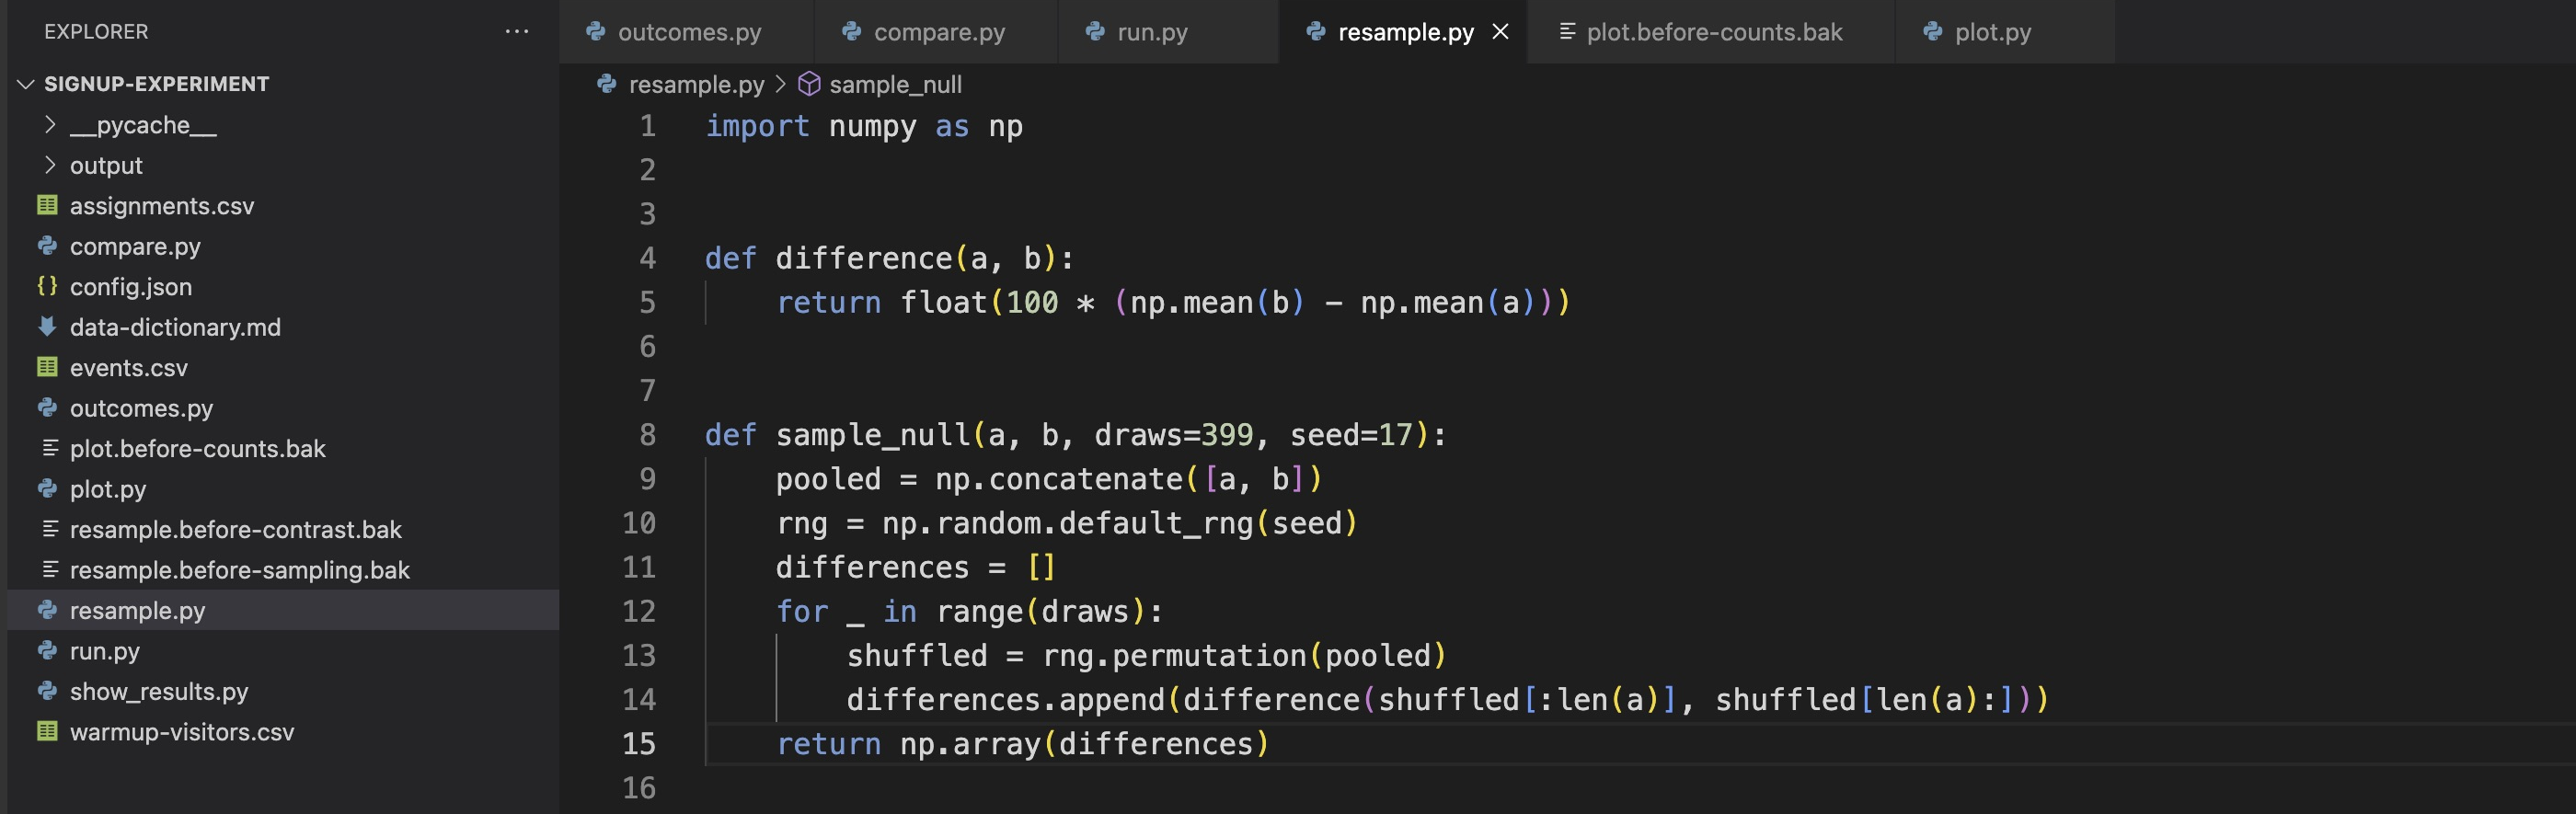
np.concatenate([a, b]) pools the two arrays. np.random.default_rng(seed) creates a pseudorandom generator with a reproducible starting state. Its permutation method returns a shuffled copy, leaving the pooled original intact. A slice shuffled[:len(a)] takes the first A-sized section; shuffled[len(a):] takes the remaining B-sized section. Every person is used once per draw and both group sizes are preserved. Do not shuffle the repeated raw event rows.
Open resample.py in Explorer. Your working difference function stays in place. The sample_null(a, b, draws=399, seed=17) signature already names the requested draw count and reproducible seed. You made resample.before-sampling.bak after contrast worked; that checkpoint retains difference while leaving only sampling incomplete.
Find Implement sample_null.. Replace just its comment and raise with the body below. The outer statements use four spaces; the two loop statements use eight. append retains each calculated difference, and returning an array preserves all draws rather than their average or a favorable subset.
    pooled = np.concatenate([a, b])
    rng = np.random.default_rng(seed)
    differences = []
    for _ in range(draws):
        shuffled = rng.permutation(pooled)
        differences.append(difference(shuffled[:len(a)], shuffled[len(a):]))
    return np.array(differences)
Choose File > Save. Do not overwrite or redefine difference: the sampling loop reuses the function you just tested. Read run.py's sample branch: base_result rebuilds people from the original CSVs, then your functions calculate the observed difference and actual shuffled differences. This rebuild does not automatically update a separate old output/people.json file.
The runner calls these functions on the complete person-level sample and saves its real group counts, observed difference and 399 shuffled differences. --seed supplies the reproducible starting state; the two hyphens mark a named command option.
python3 run.py sample --seed 17
python3 show_results.py sample
The full data still has 1 of 6 signed up in A and 5 of 6 in B, an observed difference near +66.67 percentage points. null_count must be 399. The reader shows only the first eight draws as null_preview to keep the display manageable; the complete array is saved in output/sample.json.
Generate a second ordinary sample to see why a seed is not an authoritative answer:
python3 run.py sample --seed 42
python3 show_results.py sample
This replaces the saved sample with the actual seed-42 run. The sequence generally changes, while the original person outcomes, group sizes and observed comparison stay the same. Running the same seed again must reproduce the same sequence. Any nonnegative reproducible seed and equivalent independent sampling implementation are permitted; there is no required author sequence. Do not keep rerunning to find a sample that seems to favor a page. The later exact analysis uses all allocations, not whichever exploratory sample looks nicest.
Every shuffled statistic lies between −100 and +100 percentage points, though not every number in that interval is attainable. For the six-person warmup, all 20 distinct three-versus-three allocations give counts 1, 9, 9, 1 at differences −100, −100/3, +100/3, +100. The full 12-person sample has 924 allocations: their counts are 1, 36, 225, 400, 225, 36, 1 at −100, −200/3, −100/3, 0, +100/3, +200/3, +100. The next lab performs an exact computation rather than asking you to memorize these counts.
For this exploratory training task, each attainable difference's sampled frequency may differ from its exact reference frequency by at most 0.15 in absolute proportion. For example, 0.40 and 0.46 differ by 0.06. This is a deliberately broad training acceptance tolerance, not a confidence interval, a significance threshold, a business guarantee or a criterion for selecting a seed. It allows ordinary samples and independent methods without requiring identical arrays. In a legitimate all-zero example, every reassignment difference is zero; a nonzero spread is not required.
The function contract applies to the supplied binary arrays and the same bounded course variations: at least two people in each group and at most 14 overall. Checks use isolated inputs and seeds, including other group sizes, negative and zero differences and degenerate outcomes. They never replace the live sample. No sampled p value is requested or graded.
If an edit fails, use the traceback to locate and correct the current function, save, then rerun sample. The optional recovery below returns only resample.py to its post-contrast, pre-sampling checkpoint, preserving the working difference. Reapply the sampling body and save before rerunning; neither setup nor Results will repair it.
cp resample.before-sampling.bak resample.py
After restoring the sampling checkpoint, keep difference unchanged. Reapply only the sample_null body and choose File > Save before running it again.
Plot the Saved Allocation Differences
In this step, you will display the actual sampled count at each difference and mark where the unchanged observed comparison lies.
Continue in the same WebIDE terminal panel at /home/labex/project/signup-experiment. np.unique(..., return_counts=True) returns the distinct saved differences and their occurrence counts. This is a discrete count chart: its vertical axis says how many of the 399 reassignments produced each difference. It is not an effect-confidence interval.
The plot function receives your saved result and an output path. The PNG must be at least 500 × 250 pixels to remain readable. figsize=(9, 4.5) sets the figure size in inches. DPI (dots per inch) sets the saved raster resolution: 140 pixels per inch gives about 9 × 140 by 4.5 × 140, or 1260 × 630 pixels. Matplotlib's subplots creates a figure and axes. bar draws counts, and axvline marks the observed difference without pretending it is another allocation count. A label and visible legend identify that mark. Fixed horizontal limits from −110 to +110 leave room for every possible binary-rate difference, even if an extreme value was absent from this finite sample. The vertical axis starts at zero; tight_layout leaves room for labels before savefig writes a real PNG.
Open plot.py in Explorer and read make_plot(result, destination). Imports, the figure/axes, labels, limits, layout and PNG saving are prepared. Its three pending regions separate the actual count extraction, count drawing and observed comparison; none is calculated by Results. Make a checkpoint before editing:
cp plot.py plot.before-counts.bak
Replace only the comment and raise for Implement allocation_counts. with the four-space-indented assignment below. It reads the full saved null array, not the reader's eight-value preview:
differences, counts = np.unique(result["null"], return_counts=True)
A white outline can cover the fill of a very short bar, so omit it to keep a real count of one visible. In Implement count_artist., replace its comment and raise with this count-to-bar binding:
ax.bar(differences, counts, width=8, color="#6374cc")
In Implement observed_artist., replace its comment and raise with the actual observed-position binding. The continuation line remains part of this call:
    ax.axvline(result["difference_pp"], color="#cc5b43", linewidth=2,
               label="Observed B − A")
Keep the surrounding figure setup and saving lines; choose File > Save. You have connected data to the existing chart rather than pasted a new plotting module.
Read the existing saved sample and draw it with your function:
python3 run.py plot-sample
Switch to Results, select All files / Refresh, then View beside output/sample.png. Read the two axis labels. Most counts should cluster around a difference near zero; the red observed mark remains near +66.67 percentage points. A value absent from the sample has count zero, not an omitted person. All 399 draws and all 12 original people are still represented in the saved data. Next select All files / Refresh and View beside output/sample.json to read that actual saved sample. Select All files / Refresh to return to the file list, then use Download beside output/sample.png and output/sample.json to save the actual artifacts. Their bytes come from your saved files. After viewing and downloading, return to WebIDE and its existing terminal panel before further commands.
The reference image below uses the NumPy seed-42 example just run. Another permitted sampler or seed may change the bar heights; your saved file must show your own actual draws.
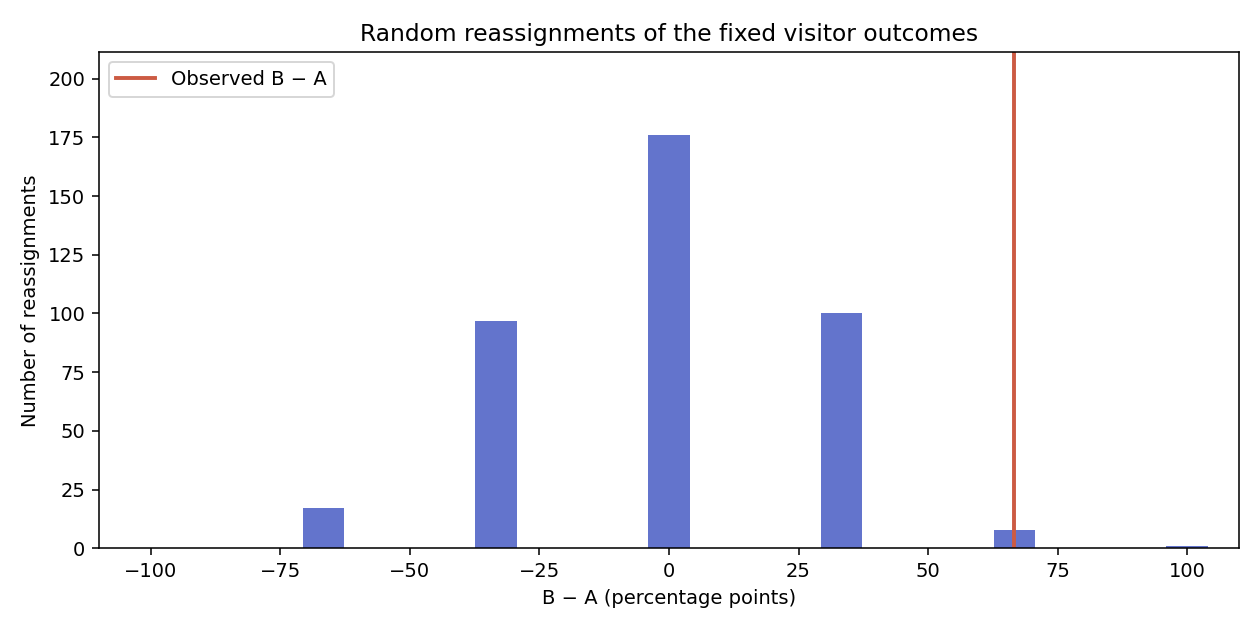
The saved PNG must be reproducible from your current plot function and saved sample. You can use readable bars, a count line or count points at the actual difference values, with a visible line or point labeled Observed at the observed difference. Keep all possible differences and the observed mark inside the displayed axes, retain the zero count baseline and label both axes. Hiding a mark, clipping the data, copying an unrelated image or plotting density while labeling it as counts does not complete this task.
If the PNG is missing, first confirm python3 show_results.py sample can read a saved sample, then rerun the plotting command. The reader itself does not generate missing files. In the next lab, you will compare an exact allocation distribution with the observed result and learn what that evidence does and does not say.
For an ordinary editing failure, correct the named line in plot.py, save and rerun plot-sample. If you need its original scaffold, the optional command below resets only this plotting module. Reapply the three data-binding regions; the completed sampler and saved sample remain intact.
cp plot.before-counts.bak plot.py
If you generate a different sample later, rerun plot-sample afterward. The plot stage reads the saved JSON; an older PNG does not automatically track a newer sample.
Summary
You hand-exchanged two memberships, generated 399 real fixed-size visitor reassignments and plotted their saved differences alongside the observed comparison. A reproducible seed makes a run repeatable; it does not choose an answer or a winning page. You now have the intuition needed to read the next lab's exact evidence.